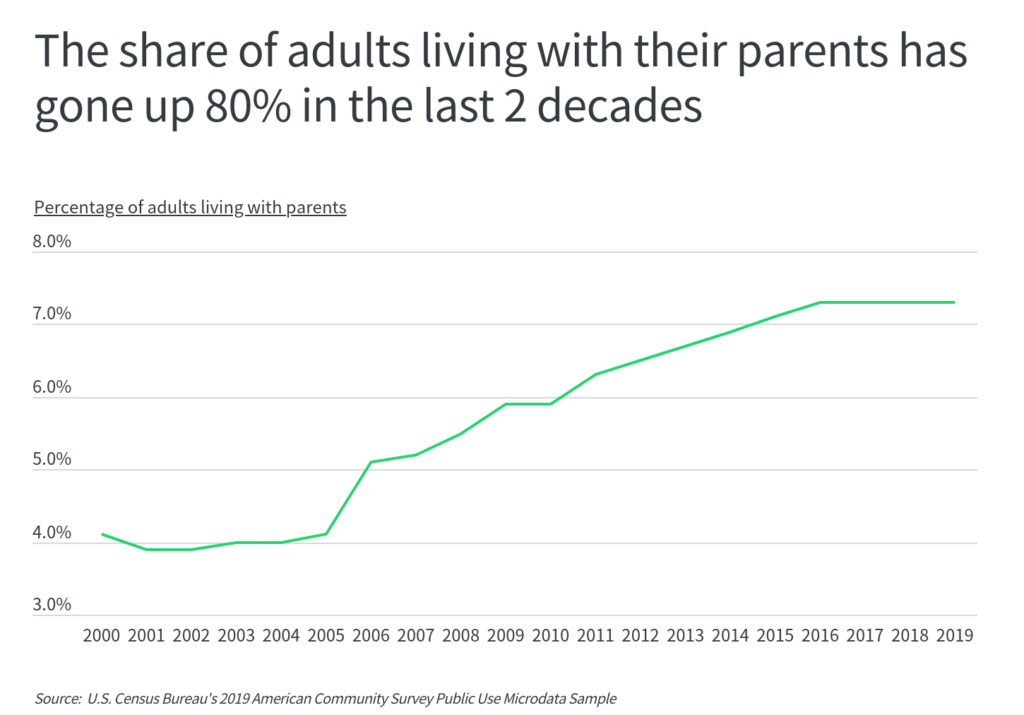
The share of adult children living with their parents is much higher than even 20 years ago due to factors such as lower marriage rates, rising housing costs, and more recently higher unemployment rates. According to the most recent data from the U.S. Census Bureau, the share of adults aged 25 and older living in their parents’ homes was 7.3% in 2019. However, experts predict this number is likely to climb even higher as a result of the COVID-19 pandemic.
In 2001, the share of adults 25 and older living with their parents was just 3.9%. After rising to 7.3% in 2016, the figure remained largely unchanged for several years. New data from the Pew Research Center, however, found that the pandemic resulted in a substantial increase in the share of young adults aged 18 to 29 years old living with their parents, from 47% in February 2020 to 52% just a few months later. While young adults are more likely than older adults to move back home, the pandemic will undoubtedly build upon the longer-term trend of more adults overall choosing to remain in their parents’ households.
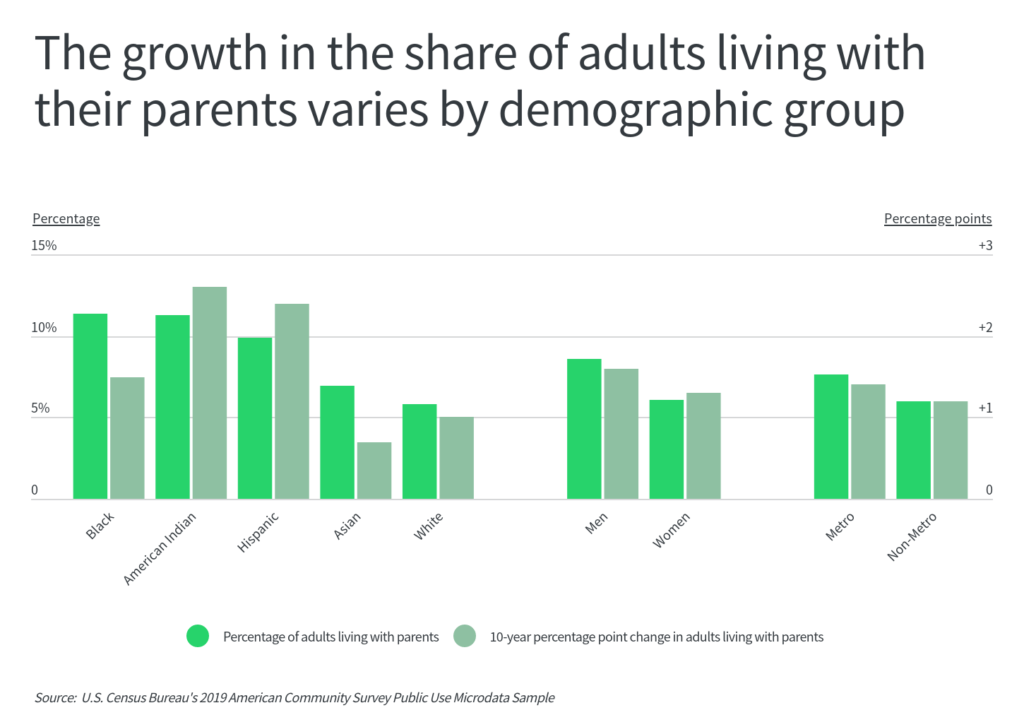
Not only does the share of adults living with their parents vary by age, but also factors such as race, gender, and location. At 5.8%, non-Hispanic White adults are the least likely racial group to live with their parents—a share that has grown by just a single percentage point over the last 10 years. In comparison, at 11.3%, American Indian or Alaska Native adults are one of the most likely groups to live with their parents. This share has grown by 2.6 percentage points over the same time period, enough to rival the share of Black adults living with their parents, which stands at 11.4%.
Men are more likely than women to live with their parents (8.6% of men compared to 6.1% of women), and this difference has widened over the last decade. Similarly, adults living in metropolitan areas are more likely to live in their parents’ home (7.6%) than those located outside of metropolitan areas (6.0%), and this gap has also widened in recent years alongside rising housing costs in major urban areas.
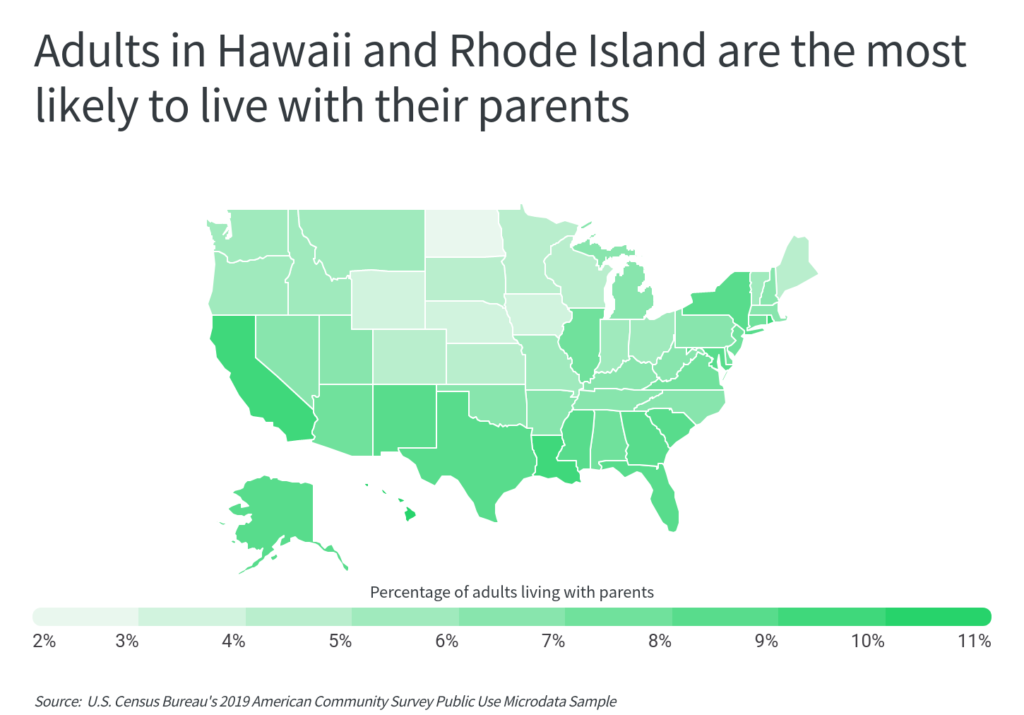
On a geographic level, both economic and cultural differences all impact how likely adults are to remain living with their parents. For example, states in the Midwest that are more affordable and have above-average marriage rates tend to have fewer adults still living with their parents. Examples include North Dakota, Nebraska, and Iowa. In contrast, states with lower marriage rates that are either highly expensive—such as Hawaii, Rhode Island, and California—or have more limited job opportunities—such as Louisiana and Mississippi—generally report larger numbers of adults still living in their parents’ home.
DID YOU KNOW?
Choosing a name for your startup that can generate organic traffic is a great way to stand out from the competition, and you don’t need to pay a professional to do it. Check out our free business name generator, and get your business rolling.
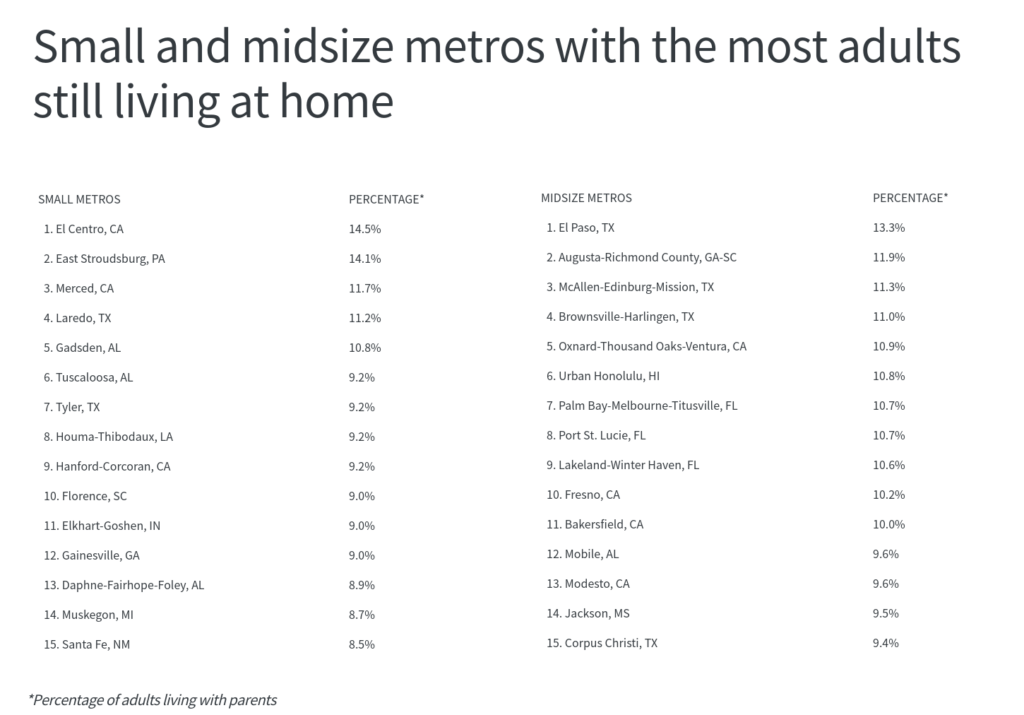
To determine the U.S. metropolitan areas with the most adults still living at home, researchers at NameChk analyzed the latest data from the U.S. Census Bureau. The researchers ranked metros according to the percentage of adults aged 25 and older still living at home with their parents. Researchers also calculated the percentage of adults ever married, the total number of adults living with their parents, and the 10-year percentage point change in the share of adults living with their parents. To improve relevance, only metropolitan areas with at least 100,000 people were included in the analysis.
Here are the metros with the most adults still living at home.
Large Metros With the Most Adults Still Living With Their Parents

15. Detroit-Warren-Dearborn, MI
- Percentage of adults living with parents: 8.0%
- Percentage of adults ever married: 75.3%
- Total adults living with parents: 235,436
- 10-year percentage point change in adults living with parents: -0.1
TRENDING
Today’s website builders have a ton of pre-made templates to choose from. The templates are all customizable, but each template itself provides the design and format to the overall site. These are the best website builders out there.

14. Richmond, VA
- Percentage of adults living with parents: 8.1%
- Percentage of adults ever married: 76.3%
- Total adults living with parents: 71,640
- 10-year percentage point change in adults living with parents: +2.6

13. Tampa-St. Petersburg-Clearwater, FL
- Percentage of adults living with parents: 8.1%
- Percentage of adults ever married: 78.8%
- Total adults living with parents: 185,113
- 10-year percentage point change in adults living with parents: +2.5

12. Chicago-Naperville-Elgin, IL-IN-WI
- Percentage of adults living with parents: 8.2%
- Percentage of adults ever married: 75.0%
- Total adults living with parents: 519,812
- 10-year percentage point change in adults living with parents: +0.8

11. Philadelphia-Camden-Wilmington, PA-NJ-DE-MD
- Percentage of adults living with parents: 8.6%
- Percentage of adults ever married: 74.0%
- Total adults living with parents: 358,476
- 10-year percentage point change in adults living with parents: +1.4

10. New York-Newark-Jersey City, NY-NJ-PA
- Percentage of adults living with parents: 8.7%
- Percentage of adults ever married: 73.4%
- Total adults living with parents: 1,190,844
- 10-year percentage point change in adults living with parents: +0.5

9. Providence-Warwick, RI-MA
- Percentage of adults living with parents: 8.8%
- Percentage of adults ever married: 75.1%
- Total adults living with parents: 99,947
- 10-year percentage point change in adults living with parents: +2.0

8. San Diego-Carlsbad, CA
- Percentage of adults living with parents: 8.9%
- Percentage of adults ever married: 77.4%
- Total adults living with parents: 200,476
- 10-year percentage point change in adults living with parents: +2.5

7. Orlando-Kissimmee-Sanford, FL
- Percentage of adults living with parents: 9.4%
- Percentage of adults ever married: 76.8%
- Total adults living with parents: 162,684
- 10-year percentage point change in adults living with parents: +2.1

6. Miami-Fort Lauderdale-West Palm Beach, FL
- Percentage of adults living with parents: 10.2%
- Percentage of adults ever married: 76.0%
- Total adults living with parents: 442,468
- 10-year percentage point change in adults living with parents: +2.3

5. Memphis, TN-MS-AR
- Percentage of adults living with parents: 10.2%
- Percentage of adults ever married: 72.9%
- Total adults living with parents: 83,624
- 10-year percentage point change in adults living with parents: +3.1

4. Los Angeles-Long Beach-Anaheim, CA
- Percentage of adults living with parents: 10.6%
- Percentage of adults ever married: 71.1%
- Total adults living with parents: 958,302
- 10-year percentage point change in adults living with parents: +2.6

3. New Orleans-Metairie, LA
- Percentage of adults living with parents: 10.8%
- Percentage of adults ever married: 72.7%
- Total adults living with parents: 94,618
- 10-year percentage point change in adults living with parents: +2.3
RELATED
A business plan isn’t required by any government entities for you to start a business. However, if you’re seeking financial assistance like a small business grant, loan, or investor commitments, you’ll likely need a very detailed business plan. Here’s our guide on how to start a business.

2. San Antonio-New Braunfels, TX
- Percentage of adults living with parents: 11.1%
- Percentage of adults ever married: 77.3%
- Total adults living with parents: 176,838
- 10-year percentage point change in adults living with parents: +2.6

1. Riverside-San Bernardino-Ontario, CA
- Percentage of adults living with parents: 11.6%
- Percentage of adults ever married: 78.1%
- Total adults living with parents: 343,401
- 10-year percentage point change in adults living with parents: +4.3
Detailed Findings & Methodology
To determine the U.S. metropolitan areas with the most adults still living at home, researchers at NameChk analyzed the latest data from the U.S. Census Bureau’s American Community Survey Public Use Microdata Sample. The researchers ranked metros according to the percentage of adults aged 25 and older still living at home with their parents. Researchers also calculated the percentage of adults ever married, the total number of adults living with their parents, and the 10-year change in the percentage of adults living with their parents.
To improve relevance, only metropolitan areas with at least 100,000 people were included in the analysis. Additionally, metro areas were grouped into the following cohorts based on population size:
- Small metros: 100,000-350,000
- Midsize metros: 350,000-1,000,000
- Large metros: more than 1,000,000